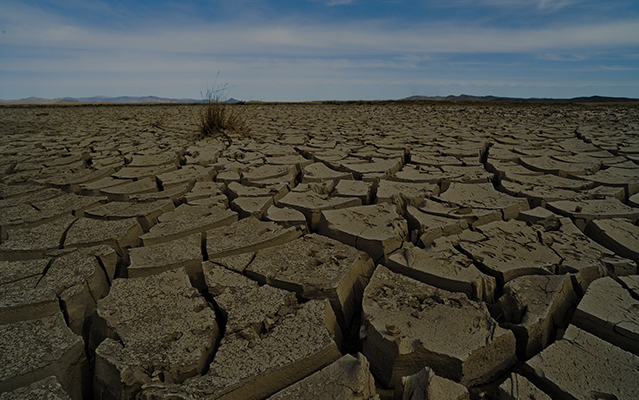
Troublesome Trends in TFP Growth

Agricultural productivity will be the linchpin of strengthening the world’s agricultural systems in the next decade. It increases producers’ incomes, can lower consumer costs, and reduces the environmental impact of food and agricultural production.

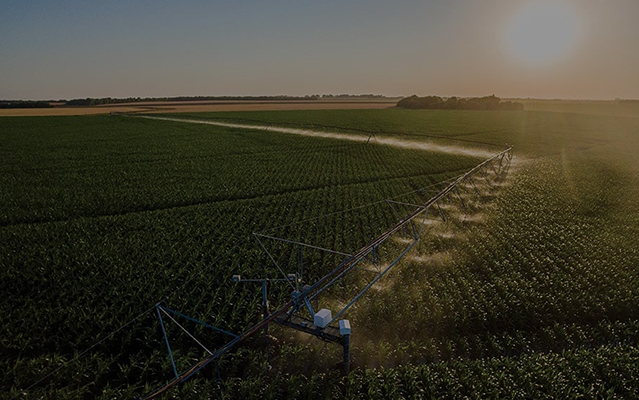
Agricultural productivity growth, measured as total factor productivity (TFP), increases when producers increase their output of crops, livestock, or aquaculture products, using the same amount or less land, labor, capital, fertilizer, feed, and livestock (Figure 1).

In other words, TFP rises when producers utilize innovative agricultural technologies to increase output with the same amount or fewer resources. For example, healthy animals produce more meat so that the farmer can increase their output without additional animals. By combining precision equipment, data analytics, and advanced seed varieties, producers know when to plant, where every seed is located, and the exact amount of fertilizer or crop protection products needed in every section of the field.

Since TFP incorporates a range of inputs and outputs in its calculation, it is “the broadest available measure of technical efficiency and productivity over time” (Fuglie & Steensland, 2022). As a result, tracking changes in TFP reveals a great deal about agricultural systems.

Global Agricultural Productivity Index Slowing Productivity Growth

Figure 1:

Total Factor Productivity

First

First, an increase in TFP shows that a large and increasing number of producers are adopting new technologies and practices. This also indicates the extent to which new technologies are accessible to farmers. It may also show the effectiveness of farmer training and extension systems.

Second

Second, TFP growth makes the agriculture sector, including producers, more competitive by lowering production costs. A one percent increase in productivity growth is equivalent to a one percent decrease in the cost of producing, storing, and selling one unit of a particular product. Consumers can also benefit since the per-unit price for the producers works its way through the value chain, influencing the prices consumers pay.

Third

Third, TFP encompasses three inputs that contribute significantly to agriculture’s environmental impact: land, fertilizer, and livestock. Therefore, an increase in TFP generated by more efficient use of land, fertilizer, or livestock reflects progress toward a more sustainable approach to agricultural production.

The 2022 GAP Index reveals the lowest level of TFP growth to date, an average of 1.12% per year (2011–2020), far below the target of 1.73% annual growth (Figure 2). If this rate remains unchanged, the gap will widen over time, making it increasingly difficult to close.

The implications of this growing gap are the widespread use of unsustainable agricultural practices, including the conversion of wild and marginal lands to agricultural production. As a result, a portion of the gap will remain unfilled, leading to unacceptably high levels of hunger, malnutrition, and rural poverty.

TFP growth rates have declined for all country income groups, but low-income countries, where TFP has contracted by 0.04% annually during 2011–2020, are of significant concern. This contraction in TFP growth may exacerbate the already high levels of food insecurity and malnutrition and threaten the prospects for economic development in these nations. The experience of China and Southeast Asia shows that the agriculture sector can be a driving force for economic growth if producers can access innovations and services to increase their productivity (Fuglie et al., 2012). Given the current negative TFP growth rate in low-income countries, it is clear that current approaches are not sufficient.

The middle-income countries have rates of TFP growth above the global average yet less than the global target. Productivity growth has slowed in two regions that experienced high TFP growth in the 2000s: China and the countries of the former Soviet Union.

Figure 2:

2022 Global Agricultural Productivity Index

TFP growth rates are based on a 10-year rolling average over a ten-year period.

A Global View of TFP Trends

To appreciate the role of total factor productivity growth in agricultural systems, it is helpful to compare agricultural output and input use over time (Figure 3). Since 1961, gross agricultural output has increased fourfold while input use has slightly more than doubled. The distance between the two lines reflects the output that can be attributed to the e cient use of agricultural inputs, some with a substantial environmental impact: land conversion, fertilizer, and livestock. In other words, TFP growth. Moreover, comparing agricultural input to output use over time demonstrates the essential role of TFP growth in the sustainability of agricultural systems (Fuglie et al., 2012).

Agricultural productivity growth is the primary source of global agricultural output growth since the 1990s (Figure 3). When TFP grows, land expansion can be limited or eliminated, and fewer inputs are needed on each acre of agricultural land. Extension of irrigation, especially in China, supported TFP growth and allowed producers to intensify their crop rotations, producing more crops on the same plot of land.

In contrast to global trends shown in Figure 3, low-income country agricultural output growth (more than 400 percent since 1961) has relied largely on increasing inputs, especially land expansion, arguably the least sustainable way to grow agricultural output. TFP growth in low income countries continues to lag well behind the rest of the world, and suggests that agricultural sustainability and food security will continue to be elusive (Figure 4).

The most recent data show a sharp decline in TFP and output growth (Figure 5). The average annual TFP growth rate declined from 1.99% in 2001–2010 to 1.12% in 2011–2020. The contribution of land expansion (much of this in Sub-Saharan Africa) to output growth more than doubled between the two decades, while the rate of input intensification declined by 17%.

In addition to the significant drop in TFP growth, the USDA Economic Research Service is reporting for the first time that agricultural output grew by less than 2% (average annual growth, 2011–2020).

This raises concerns about the prospects for reducing the recent increases in food insecurity and malnutrition. It is important to note that these data reflect impacts from only the first nine months of the COVID-19 pandemic, and no influence from the Russia-Ukraine war. In other words, the 2011–2020 TFP data illustrate a worrisome global trend of declining TFP growth. Climate change and other types of resource degradation may be taking a larger toll on productivity as well as a slower pace of change in the development and adoption of improved technology.

At the start of the twentieth century, producers around the world opened up new land for cultivation and grazing to increase their output. Then in the 1960s, the Green Revolution gave millions of farmers access to effective pesticides, fertilizer, and irrigation, sharply increasing output and preventing mass starvation (Figure 5). Subsequently, improved technologies and practices enabled producers to use their land and inputs more efficiently (i.e. TFP increased). By the 1990s, global agricultural productivity growth was the primary driver of global agricultural output growth, and was well above the target 1.73 percent annual growth during 2001–2010. However, as noted above, TFP growth declined sharply during 2011–2020. At the same time, the contribution of land expansion to output growth more than doubled during this period.

The Organisation for Economic Cooperation and Development (OECD) is predicting 1.4% annual growth in food demand during 2022–2031, mostly due to population growth. Total agricultural output growth averaged 1.93 percent during 2011– 2020 (Figure 4). According to OECD’s population growth projections (Figure 6), world per capita GDP growth will exceed population growth, meaning that net per capita income should increase worldwide. This trend is predicted to be especially pronounced in India, China, and Southeast Asia. In contrast, population growth in Sub-Saharan Africa will be more than twice that of GDP. Thus, increasing TFP growth will be especially critical in this region to meet food demand and maintain an affordable food supply while protecting the natural capital on which agricultural production relies.

Figure 3:

Global Agricultural Outputs, Inputs, and Total Factor Productivity (TFP), 1961-2020

Figure 4:

Low Income Agricultural Output, Input, and Total Factor Productivity (TFP), 1961-2020

Figure 5:

Global Sources of Agricultural Output Growth, 1961-2020

Figure 6:

Population and Income Growth Projections, 2023-2032

TFP Trends by Region

Examining TFP growth in key regions provides additional perspectives on productivity trends (Figure 7). Although global TFP growth during 2011–2020 was alarmingly low at 1.12%, TFP growth continues to be robust in South Asia and the Transition Countries (former Soviet Union) at 2.28 percent and 1.89 percent, respectively. In China, TFP growth was under 1 percent in the 1970s, and Transition Countries were experiencing negative TFP growth as recently as the 1990s. Market-driven policy changes have sparked a TFP transformation in these countries. Yet history shows that once these changes are integrated into the agricultural sector, TFP growth will slow down. China is a case in point. China’s TFP growth averaged 2.48 percent from 2001 to 2010, falling to 1.59 percent from 2011–2020. The next challenge for countries is maintaining a steady rate of TFP growth through continued policy improvements and investments in agricultural R&D.

Sub-Saharan Africa is a cautionary tale in this regard. Policy reforms in the 1980s and respectable TFP growth, but with minimal investments in agricultural R&D, the region has been unable to sustain or improve TFP growth. The region is now experiencing negative TFP growth. Countries that have invested in the success of emerging farmers (marketoriented, cultivating  ve to 20 hectares) have made significant strides in TFP growth, including South Asia and Southeast Asia. Sub-Saharan Africa has a small but active population of emerging farmers. They have the most potential for productivity growth but urgently need access to improved technologies and agronomic information, as well as an enabling policy and trade environment for TFP growth.

In Sub-Saharan Africa, underinvestment in agricultural research and development and farmer training throughout most of the continent has left farmers with few options for increasing output (Fuglie and Rada, 2013). With limited access to productivity-enhancing technologies such as mechanization, advanced seeds, fertilizer, and improved livestock breeds and feed, farmers are expanding crop and grazing lands at an alarming rate, with negative impacts on biodiversity.

In South Asia, TFP grew at a robust average annual rate of 2.28 percent during 2011–2020, essentially the same growth rate as during 2000–2010. Input intensification and irrigation extension are contributing significantly to output growth. Extending and improving India’s irrigation systems boosted productivity on already cultivated land. Increased access to mechanization services and improved seed genetics have reduced the need for agricultural labor. Land expansion for agriculture is now near zero.

The rate of TFP growth in North America has slowed from 1.6 percent annual growth during the 1990s and 2000s to a paltry 0.16 percent during 2011–2020. The slowdown coincides with decreased public-sector agricultural research and development investments—the cornerstone of TFP growth. According to the USDA Economic Research Service, in 2019 U.S. public agriculture and food R&D expenditures in constant dollars reached its lowest level since 1970. A renewed commitment to public investment in agricultural innovations, especially in the United States, is crucial to return to robust TFP growth. Furthermore, U.S. agricultural R&D innovations can bene t other countries as well.

Similar to North America, TFP growth in Latin America and the Caribbean (LAC) was robust, growing at more than 2 percent annually during 1991–2010. Precision agriculture, advanced seed technologies, and improved livestock management systems have driven substantial TFP growth in feed grains and livestock production in countries such as Brazil and Chile. However, during 2011– 2020, TFP growth in LAC decreased to less than 1 percent annually, and input intensification became the leading contributor to agricultural output growth.

TFP growth in Europe remains sluggish at about 1 percent annually. Output and TFP growth have been strong in breadbaskets of the former Soviet Union, particularly Russia and Ukraine, far above those of EU countries. However, the current Russia-Ukraine conflict is creating input and food supply and price crises globally, and will undoubtedly reduce TFP

Figure 7:

Sources of Agricultural Output Growth by Region, 2011-2020

Partner Case Study: Partner Name
Close